One thing I have been playing around with lately is Heart Rate Variability(HRV) as a way monitor the effects of my training load. I used to do this strictly by testing my resting heart rate(RHR) every morning, but HRV can tell you much more about what is going on in your body using the other details of your heart beat.
I first found out about HRV a few years ago from a chiropractor who would measure this occasionally to diagnose my overall health. He never really explained the details about it. More recently, I was re-introduced to this measurement through listening to the Ben Greenfield Fitness podcast. If you are not familiar with Ben’s podcast, he is very knowledgeable guy in the field of exercise, training and biochemistry. Ben uses himself as a “guinea pig” for many of the things he recommends and is quite insightful. Listening to his podcast conjures up images of this really fit guy walking around with electrodes and monitors attached all over his body and pushing a cart full supplements around. Ben is a firm believer in HRV and also monitors it every morning.
What is HRV?
So what is HRV? I am not going to get into the nitty-gritty details of it, but it uses the wave and frequency measures of your heart beat to determine the state of your autonomic nervous system(ANS). You ANS is your sympathetic(“flight or fight”) and parasympathetic(“rest and relax”) systems. When these systems are in balance, life is good. When they are not, it usually indicates a stressor on the body. A heartbeat that is balanced has a variable time between each heartbeat(1.01s,0.92s,1.05s,0.98s, etc.). Less variation indicates a problem. If you would like more details about the HRV check out Ben’s podcast on it or this blog post.
How Do I Monitor HRV?
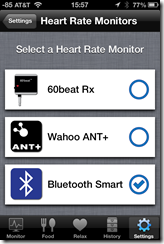
I never thought I would personally be able to monitor HRV. I assumed that the monitoring devices would be quite pricey. Low and behold, someone has come out with a iPhone app that does just that. Actually there are now several. I have been using the SweetBeat app($4.99 on iTunes) by SweetWater Health, LLC which just requires a heart rate monitor that you can communicate with your iOS device. That is either a ANT+ capable strap and a ANT+ dongle connected to your iOS Device or a Bluetooth Low Energy(BTLE) capable heart rate monitor strap. Either one should work.
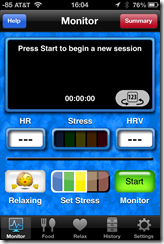
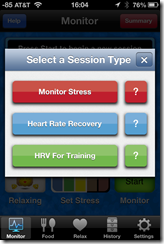
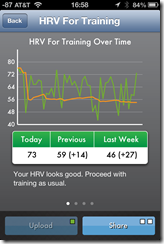
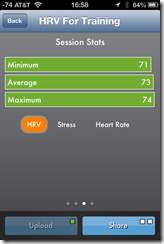
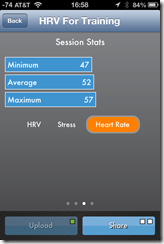
The app is pretty easy to use. First, attach your heart rate strap and pair it up with the Sweetbeat app on your iOS device, then go to the front “monitor” screen and hit the Start button. Next, select the “HRV for Training” button to conduct a 3 minute session to determine your current HRV, stress, and heart rate. When in completes you will be presented with a graph of your historical values as an indication of whether it is good or bad and if you should continue training as usual. The HRV value is between 0 and 100 and the higher the value the better the state you are in. If your value drops significantly it is usually time for easier training or at most a rest day. You can then upload the session to their servers for the highly-anticipated charts that they promise.
They recommend setting a baseline HRV initially. You can also link up the unit with their “MySweetBeat” website too, but it is pretty lame at this point. They just have a calendar which shows all your readings for the month. They do claim to add charts soon, but I haven’t seen any progress here since I started. I wish they would add the ability to download your data to a CSV file so you can analyze it yourself. I actually record the value in a spreadsheet and use my analysis tool of choice to slice and dice it.
For more info on Heart Rate Variability check out this doc…
How I Analyze HRV…
Every morning before I step out of bed I strap on a HR monitor and run a 3-minute session for stepping out of bed. My main purpose for this is to determine if I am overtraining or possibly in the process of getting sick. I am fairly certain this won’t happen since I am under a coaches tutiledge, but it is always good to know what your body is doing during different phases of Ironman Training. I also am a bit skeptical of it and want to try to either prove it right or wrong.
Looking at my daily HRV values(above) really doesn’t show too much other than it jumps all over the place. The values in the first few weeks of my training season were a bit higher, but that was because Sweetwater Health changed their HRV algorithm resulting in lower values since then. So, ignoring the first couple weeks and looking at a rolling weekly average I can see it is remaining pretty steady at around 60-65, which I guess is ok. A better way of looking at this would probably be from a summarized weekly average.
Here you can see that as my training volume(in Hours) is increasing, my HRV is decreasing. Below, I have marked the chronological weeks and the type of training week it is. I can start to see a trend where my HRV is drifts downward going from Build 1 to a Recovery week and then shoots back up again on the next “Build 1” week. This shows how the training load affects the HRV and then after a full recovery it then rejuvenates again and you are ready to go again for another 4-week cycle. Most-likely, If you didn’t have that recovery week your HRV would keep on descending until you were thoroughly exhausted and possible end up sick. It also explains why I feel like crap during my recovery weeks.
Looking at this another way, by grouping by training week type also further demonstrates this same idea. The first Build week is typically the highest and the recovery week is always the lowest. Race weeks here are basically like a recovery week since all of my races have been training races without a typical taper.
The last graph is showing the average HRV for the type of workout I do during my typical weeks. The workout assignment to the HRV value is actually the previous days’ workout since I measure the HRV in the morning. One interesting thing is that my HRV is highest the day after a race day? Hmmm…did I not go hard enough? That’s weird. Those long bike/brick days surely take their toll on my system.
That’s enough graphs and charts for now. I am curious to see how this pans out as I can heavier into training closer to Lake Placid.



2 comments
Very good blog post. I just started using sweetbeat and am planning on using this religiously to train for triathlons. I have been reading your posts and really like all the info you are putting out there.
Would you be willing to share your excel charts? I would love to be able to track hrv, training duration, ave heart rate, pte, over time.
Please feel free to email me. thanks for your help in advance!
Brian
Author
Hey Brian,
Thanks for the comment! Glad to hear someone is finding this information useful. HRV is a pretty powerful and helpful measurement.
My charts are not in Excel but instead in a product called QlikView(www.qlickview.com). It is a great tool for summarizing data from disparate sources. Check out their website if you are interested. They used to provide a free “personal” version of their product. I would be happy to share my qlikview app file with you if want.
Thanks
Brian